Every distributor review meeting in FMCG starts the same way. The Sales Manager opens the pack. Revenue is down 12%. The room exhales. The distributor's Commercial Director has a prepared answer about market conditions and a competitor price cut. The conversation goes where every conversation goes - into excuses, promises, and generic commitments to "do better next quarter." Nothing specific is resolved because the diagnosis is not specific. Revenue is down. Everyone knew that before the meeting. What nobody in the room can articulate is what is actually happening underneath that number, and therefore what to do about it.
This is the consequence of reading metrics one at a time. Single-metric dashboards are structurally incapable of producing diagnoses. They produce symptoms - a red number, an amber bar, a dropping trend line - and leave the diagnosis to the human in the room. If the human in the room is an experienced commercial leader with fifteen years in the category, sometimes they can pattern-match their way to the right answer. Most of the time they can't, because the patterns that matter are in the combination of metrics, not in any single metric by itself. And nobody has taught the dashboard how to read combinations.
The four signals that actually matter
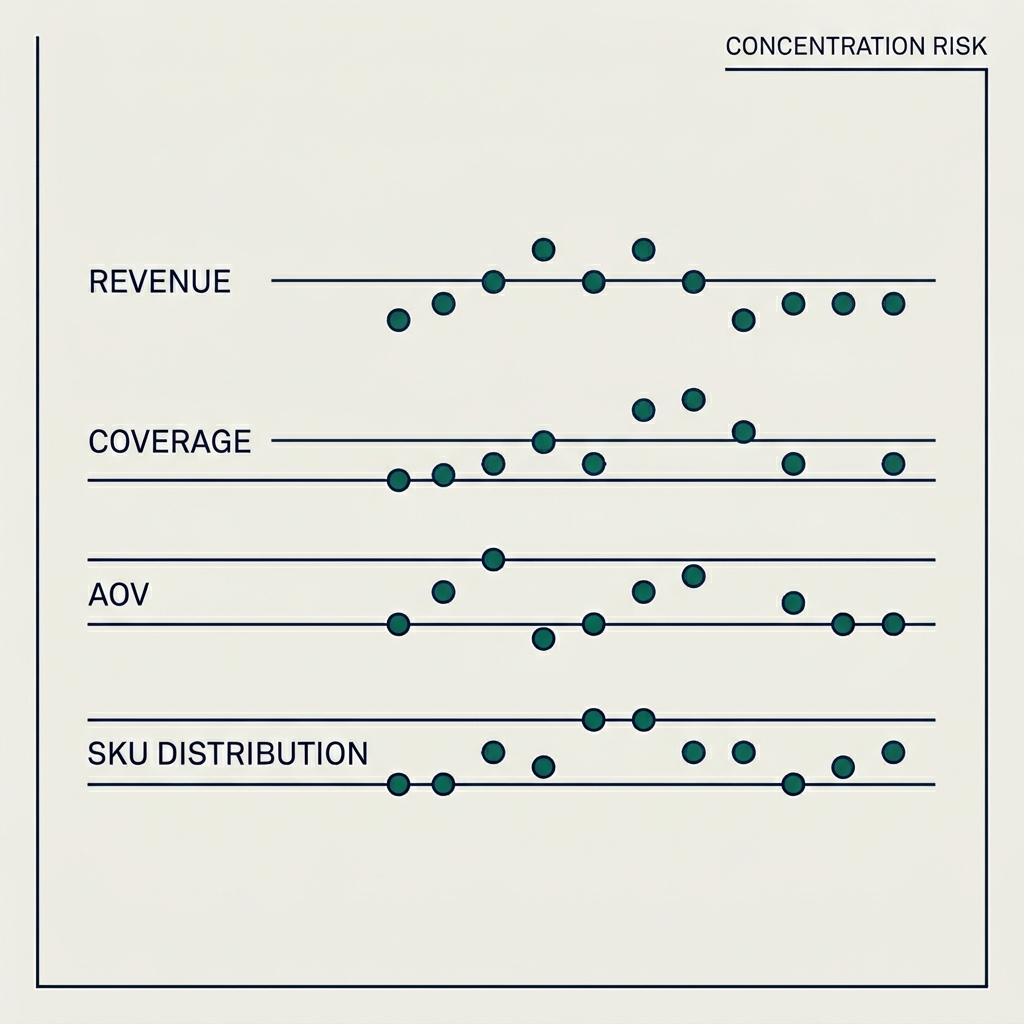
Four commitment types together contain most of what you need to know about a distributor's quarterly performance. Revenue achievement against the committed target. Outlet coverage against the committed active universe. Average order value across active outlets. SKU distribution across the committed range. Each of these metrics individually tells you something, but they tell you very different things depending on what the other three are doing at the same moment.
Revenue down, coverage fine, AOV down, SKU distribution fine. This is a breadth play gone wrong. The DSRs are visiting the right outlets and stocking the right range, but they are spreading their time across too many transactions at too low a value. The fix is a conversation about order thresholds and promotional mechanics that reward larger baskets, not a conversation about sales motivation.
Revenue fine, coverage down, AOV up, SKU distribution fine. This is concentration risk. The distributor is generating healthy numbers from a smaller-than-agreed base of outlets, and if any one of those concentrated accounts wobbles, the revenue falls off a cliff. This is an urgent signal, and it reads as healthy on a single-metric revenue dashboard. The fix is a coverage recovery plan, not a celebration of the AOV number.
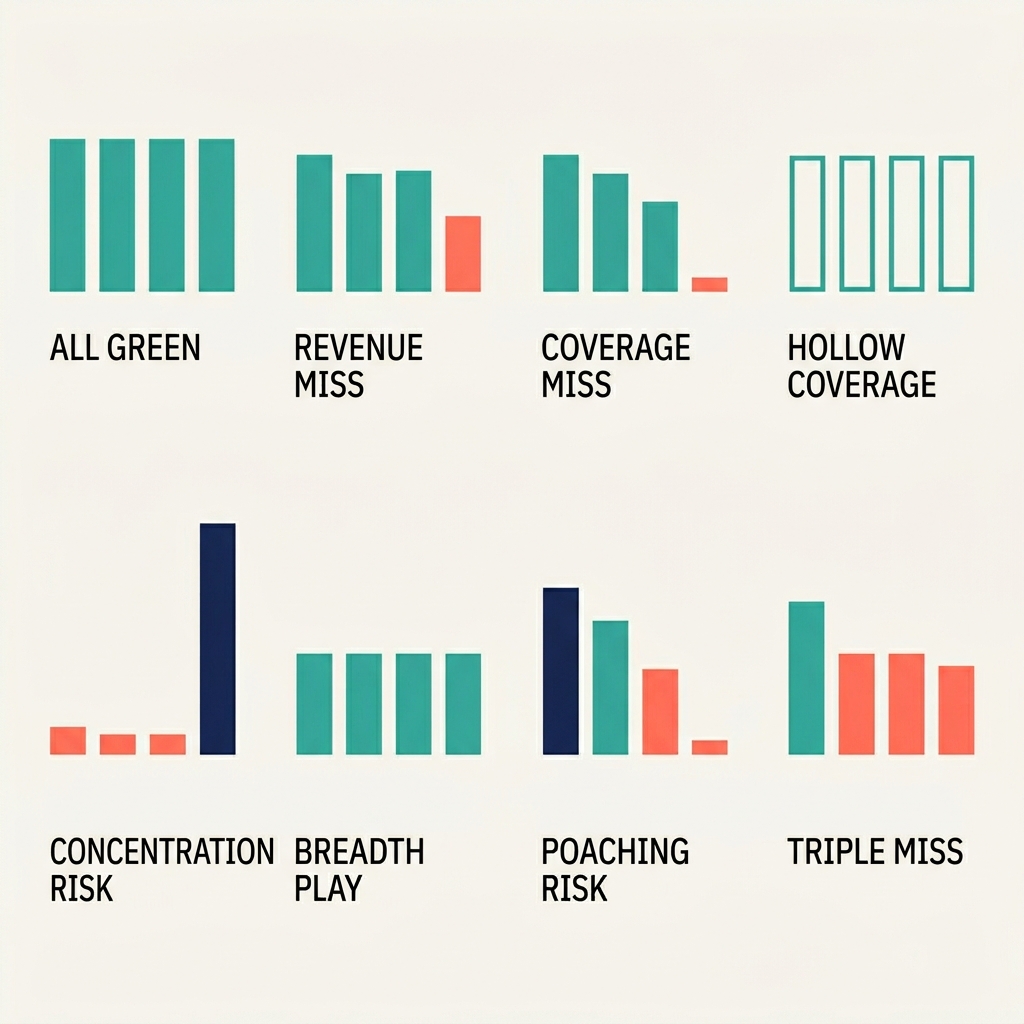
Coverage fine, SKU distribution down, revenue down. This is hollow coverage. The DSRs are visiting outlets and logging visits, but they are not selling the full range. This is often a training or incentive problem, sometimes a pricing or competitor problem, occasionally an SKU rationalisation signal if a specific SKU is being refused consistently. The fix depends on the refusal reasons in the data, not on a blanket push.
Revenue up, new outlet acquisition down, coverage fine, AOV up. This is poaching risk. The distributor is growing revenue from existing outlets, probably because a competitor is losing share in that set, but they are not opening new accounts. Growth is temporary and fragile. The moment the competitor recovers, the revenue drops. The fix is a SPANCO pipeline review and a new-outlet acquisition plan, not a volume incentive.
There are eight canonical signatures in total. They cover the common combinations that matter. Every one of them reads as a different commercial situation requiring a different commercial response, even when the headline revenue number looks similar.
Why this changes the review meeting
When the Sales Manager walks into the quarterly review meeting with a signature, the conversation starts in a different place. Instead of "revenue is down 12%, what happened," the conversation starts with "this is hollow coverage - our DSRs are visiting but not selling the full range, which reads in the refusal data as a price objection on the 5L synthetic SKU, which is consistent with the competitor promotion that started in March." The distributor's Commercial Director cannot respond with generic market-condition excuses to that opening, because the opening is specific. The conversation skips past blame and lands on action.
More importantly, the signature carries an implied time horizon. Clean overperformance is a reason to extend territory or raise targets. Concentration risk is a two-quarter problem that becomes a crisis if left alone. Hollow coverage is a six-week problem that you can fix with a focused SKU push and retraining. Poaching risk is a one-quarter window before the competitor recovers and the revenue falls. The signature tells you how urgent the intervention is, not just what the intervention should be. That changes how the commercial team prioritises their attention across a portfolio of 40 distributors.

The engineering behind the insight
A signature is not a complex algorithm. It is a decision tree reading four boolean-ish inputs - each metric either within tolerance, meaningfully below, or meaningfully above - and mapping the combination to one of eight named patterns. The intellectual work is not in the code. The intellectual work is in the taxonomy: knowing which combinations are meaningful, what each one implies commercially, and what intervention each one suggests. That taxonomy is the kind of thing that can only be built by someone who has sat through hundreds of review meetings and watched which combinations of drift predict which downstream outcomes.
The payoff is that once the taxonomy is encoded, it runs every day against every distributor across every tenant. No Sales Manager has to remember to look. No data analyst has to build a quarterly deck. The signature is in the Sales Manager's morning brief by 8am the day the composite score changes. The conversation with the distributor is different from the first day a new signature fires - and so are the outcomes.