When we first modelled route-to-market territories, we made a silent assumption: channels carry products in fixed proportions. A motorcycle workshop sells motorcycle lubricants. A wholesaler sells whatever they stock. A modern trade outlet sells modern-trade SKUs. The model assumed these proportions were stable enough to ignore.
Then we ran the numbers against a real client - a lubricants company with both car and motorcycle oil lines - and the assumption fell apart in front of us.
The discovery
The client had a motorcycle-oil distributor in Kuala Lumpur. On paper, their territory was well-designed: 62% of KL's workshops, right outlet mix, reasonable coverage density, acceptable distributor economics. But the sell-out numbers didn't match the territory model's predictions. Actual volume was 40% below forecast, and it wasn't a data quality issue - the volumes were real.
We dug in. The distributor wasn't failing at workshops. They were hitting workshop targets. They were failing at wholesalers, which were 35% of their effort but only 15% of their target volume. Why? Because the wholesalers in their territory sold 10× more car lubricants than motorcycle lubricants. The distributor, with a motorcycle-only product line, was spending a third of their route time in channels where their product category was a minority share. The wholesalers liked them - they were professional, reliable, on time - but there wasn't enough motorcycle oil demand to justify the visits.
The implication was commercial, not mathematical. The distributor was rationally going to start looking for competing car-oil brands to offer these wholesalers, because the wholesaler relationship was strong but the product fit was wrong. The territory model, by assuming fixed channel-product proportions, had masked the real strategic risk: a distributor with under-utilised relationships is a distributor one conversation away from partnering with a competitor.
The fix - and the reframe
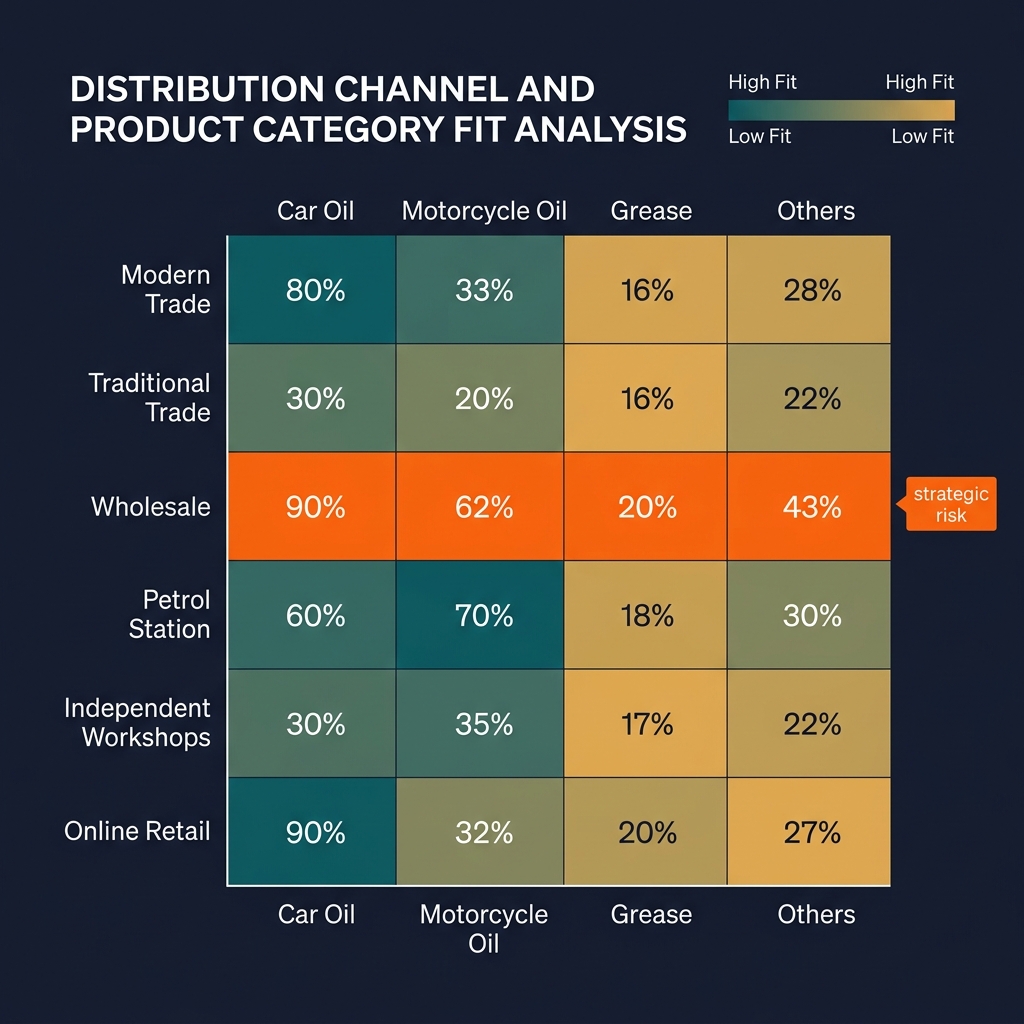
The formula fix was straightforward. Add a channel-by-product allocation matrix - for each channel archetype, the percentage of volume across product categories. Wholesalers might be 80% car oil, 18% motorcycle oil, 2% other. Petrol stations might be 55% car oil, 45% motorcycle oil. Motorcycle workshops, 100% motorcycle. These proportions are market-specific, category-specific, and senior-partner-confirmed during engagement setup. They feed into the territory sizing and into the distributor-territory P&L.
But the more interesting shift happened after the formula was in place. The matrix wasn't just an input anymore. It was a diagnostic. Open it for any territory, and you could see - at a glance - which distributors were spending effort in channels where their product category was structurally under-represented. The view wasn't about numbers; it was about strategic risk. It was about conversations the commercial director needed to have, not dashboards they needed to read.
A distributor with 35% of effort in a channel that's 15% of their category volume is a flag. Not "they're failing" - they might be hitting targets within the channel's reduced addressable share. The flag is "this relationship is vulnerable". The wholesaler has capacity for more product. If we don't fill it, a competitor will. The strategic options are: expand the distributor's product mandate (give them the car oil line too), restructure the territory to reduce wholesaler dependence (add more motorcycle-heavy districts), or accept the competitive risk and plan for the conversation when it comes.
The pattern: configuration becoming insight
Good vertical platforms do this trick repeatedly. A configuration knob, viewed the right way, becomes an executive-level question. Confidence levels weren't originally designed as a management tool - they were a data-integrity mechanism. But once the cascade was visible in the UI, they became a roadmap: upgrade this field from AI-estimated to client-confirmed, and watch the whole downstream chain turn from amber to green. The confidence view became a workstream prioritisation screen - not because we designed it that way, but because the data model made it one.
Territory boundaries started as a geographic constraint. Once they were editable, they became a strategic lever - "what if we split East Java into two territories with different distributor coverage models?" The system calculates it instantly, and the SP sees the trade-offs on a 2×2 matrix. Again, not because the boundaries were designed as a strategic tool, but because the data model, once exposed, made them one.

The channel-product matrix is the same pattern. Started as a formula input. Became a diagnostic. The move from input to insight is what separates a vertical platform from a calculator.
Why this is hard to predict in advance
The insight emerged because we were forced to model something we'd been assuming. The assumption was invisible - it was baked into how the formulas worked, and nobody had ever written it down. Breaking the assumption required a real client's data to contradict the prediction. No amount of internal review would have surfaced it, because we were all using the same mental model.
The implication for building vertical platforms is uncomfortable: your best strategic features will emerge from data anomalies, not from roadmaps. You can't predict which configuration knobs will become diagnostics until you've run the model against enough reality to find the places where the assumptions break. This argues for a build philosophy that prioritises running the system end-to-end over polishing individual features. Every end-to-end run against real data has a chance of surfacing an insight-producing anomaly. Every polish cycle on a feature you already understand has near-zero chance.
What changed after the matrix went in
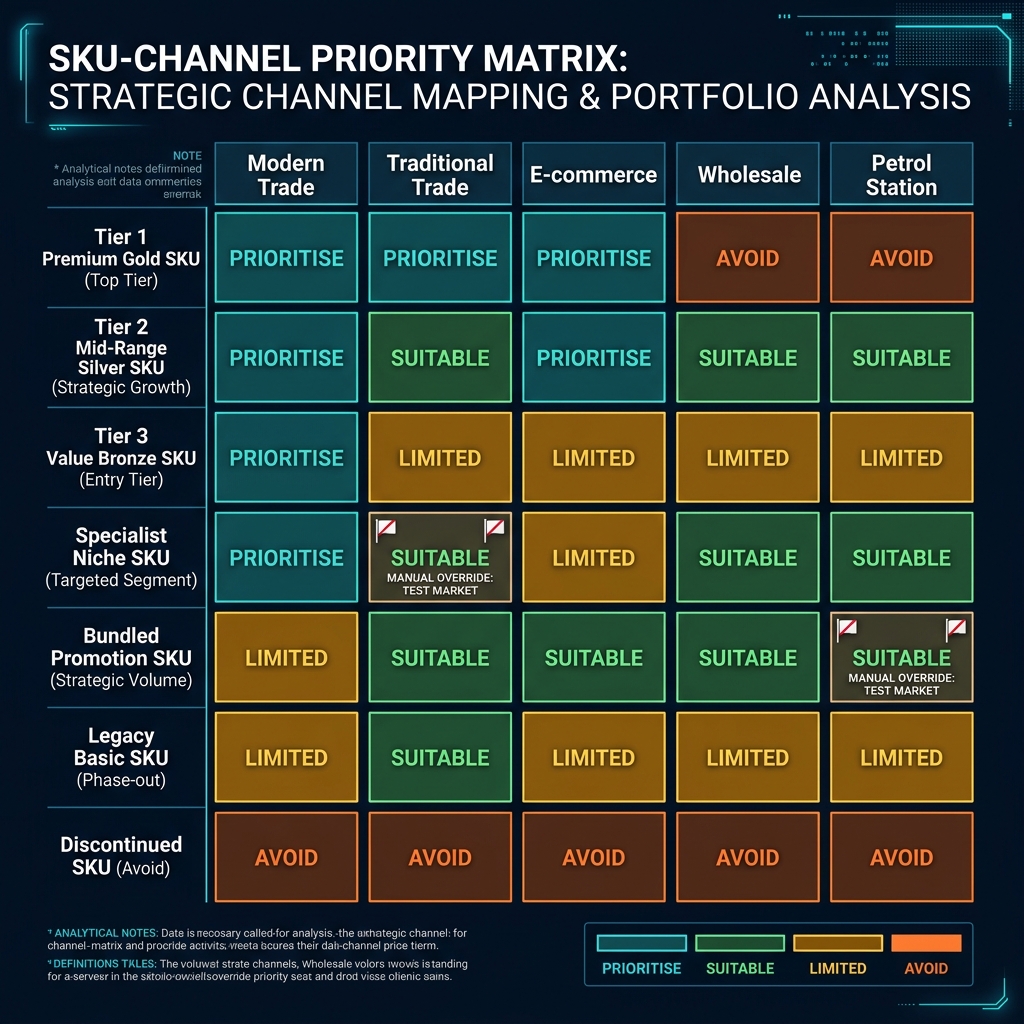
The matrix was added in a single session - one migration, one view, one upsert flow, one new field in the deck output. It became one of the most-used diagnostics in the platform. Senior partners check it during every territory review. Commercial directors ask for it in every client conversation. It features on a dedicated slide in the engagement deliverable deck, labelled "Where your effort is going versus where your product belongs".
The slide's purpose isn't to score the distributor. It's to start a strategic conversation about where the product's natural channel gravity is, and whether the current distributor set is aligned with it. For a category going through structural change - e-commerce cannibalisation, premiumisation, shifting consumer preferences - this conversation is more valuable than the territory design itself. The territory can be adjusted in a quarter. The distributor-channel fit is a multi-year negotiation.
We didn't set out to build a distributor strategic risk dashboard. We set out to fix a formula. The diagnostic emerged because we took the modelling question seriously enough to fix the assumption underneath it.